
Trending
Gold Corner
Source: Newsmaker.id
Period: October 5–9, 2026
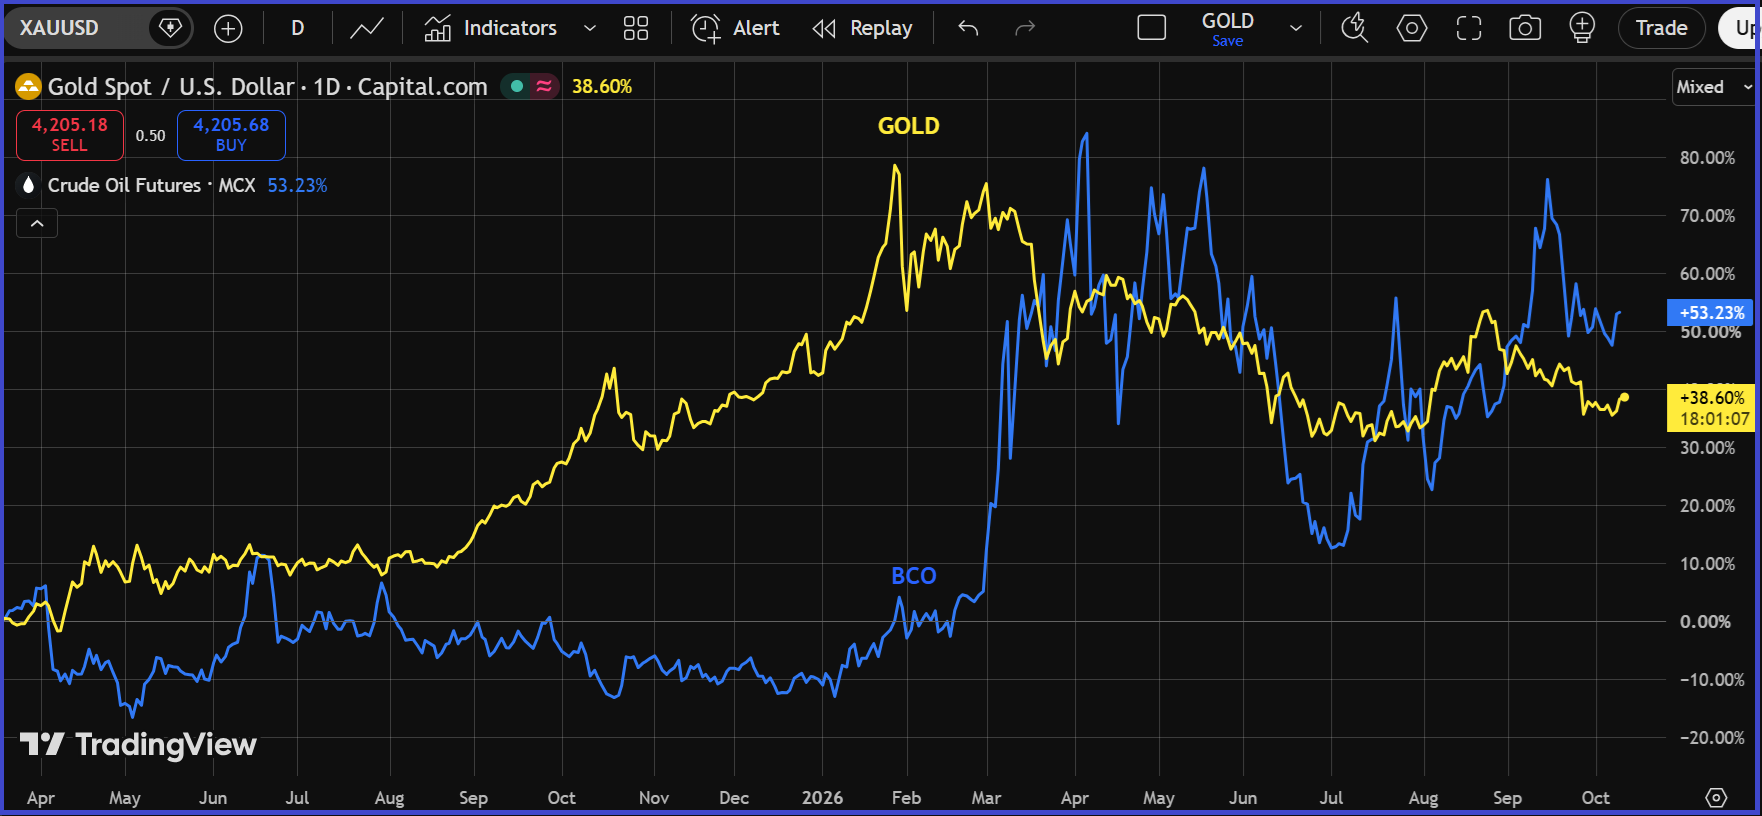
Gold prices fluctuated throughout the week, primarily pressured by a stronger U.S. dollar and rising U.S. Treasury yields, which briefly reached their highest levels in more than two decades. These conditions triggered a sharp correction in gold prices before the precious metal rebounded, supported by declining Treasury yields, a weaker dollar, and increasing safe-haven demand.
Gold's recovery was also driven by bargain hunting, fading expectations of a Federal Reserve interest rate hike, and growing concerns over elevated U.S. government debt. Overall, spot gold gained approximately 1.3% for the week, snapping a two-week losing streak. Market attention now shifts to the upcoming U.S. Consumer Price Index (CPI) report for further clues about the Fed's monetary policy outlook and gold's next direction.
Global oil prices experienced significant volatility as markets weighed supply disruption risks against improving global supply prospects. Rising crude exports from the Middle East and planned strategic reserve releases by the G7 and the International Energy Agency (IEA) initially pressured prices. However, escalating U.S.-Iran tensions, attacks on oil tankers in the Strait of Hormuz, and production disruptions caused by Hurricane Isaias in the Gulf of Mexico pushed oil prices higher.
Toward the end of the week, geopolitical tensions eased after President Trump stated that the United States would not attack Iran before the U.S. midterm elections. Meanwhile, China's plans to increase refined fuel exports further limited oil's upside potential. Overall, oil prices remained highly volatile, with market direction largely influenced by developments in the Middle East conflict, strategic reserve release policies, and global energy supply conditions.
Gold (XAU/USD) is expected to remain in a consolidation phase with a bearish bias this week, although a short-term recovery remains possible. Based on the Daily (D1) chart, with the previous closing price at US$4,194 per troy ounce, gold continues to show a lower-high structure, indicating that successive price peaks have been declining. This suggests that selling pressure has not fully subsided, while the recovery toward the end of last week remains insufficient to confirm a bullish trend reversal.
From a technical perspective, gold could extend its recovery if prices hold above the psychological level of US$4,200 and break through immediate resistance at US$4,217. If buying momentum strengthens, the precious metal could advance toward US$4,250. Conversely, a failure to maintain support around US$4,184–4,185 could trigger renewed selling pressure, potentially pushing prices toward US$4,150. Therefore, the US$4,185–4,217 range will be a key area to monitor for short-term directional signals.
From a fundamental standpoint, gold remains highly sensitive to movements in the U.S. dollar, Treasury yields, and expectations surrounding Federal Reserve interest rate policy. A stronger dollar and rising yields could limit gold's upside potential, while weakness in both could create room for further recovery. Investors will also closely monitor the U.S. Consumer Price Index (CPI) report scheduled for October 14, 2026. Higher-than-expected inflation could strengthen the dollar and weigh on gold, while softer inflation could reinforce expectations of a more accommodative Fed policy and support the precious metal.
Overall, gold's outlook for the week remains range-bound with a bearish bias and limited rebound potential. Although gold ended its two-week losing streak with a gain of approximately 1.3% last week, a sustained recovery still requires stronger technical confirmation. As long as prices fail to break decisively above key resistance levels, any gains may represent a temporary rebound within a broader corrective trend. U.S. dollar movements, Treasury yields, and upcoming inflation data will be crucial in determining whether gold extends its recovery or faces renewed selling pressure.
Brent crude oil (BCO) is expected to trade sideways with a limited bullish bias this week, following last week's closing price of approximately US$104 per barrel. Based on the Daily (D1) chart, oil continues to show signs of recovery, although selling pressure and profit-taking could limit further gains.
From a technical perspective, immediate resistance is located around US$105–106 per barrel. A sustained breakout above this range could open the door for further gains toward US$108–110. Conversely, a failure to maintain support at US$102 could trigger a downward correction toward the psychological level of US$100 per barrel.
From a fundamental perspective, ongoing geopolitical tensions in the Middle East and the risk of supply disruptions through the Strait of Hormuz continue to support oil prices. However, increasing crude exports, planned strategic petroleum reserve releases, and easing tensions between the United States and Iran could exert downward pressure on the market.
Overall, BCO retains upside potential as long as prices remain above US$102 per barrel, although a decisive breakout above US$106 is needed to confirm further bullish momentum. Geopolitical developments and global oil supply conditions will remain the primary drivers of price movements throughout the week.
This article is intended for informational and analytical purposes only and should not be considered definitive investment or trading advice. Market participants should carefully assess fundamental developments, technical indicators, and associated risks before making any investment or trading decisions.