
Trending
Gold Corner
Source: Newsmaker.id
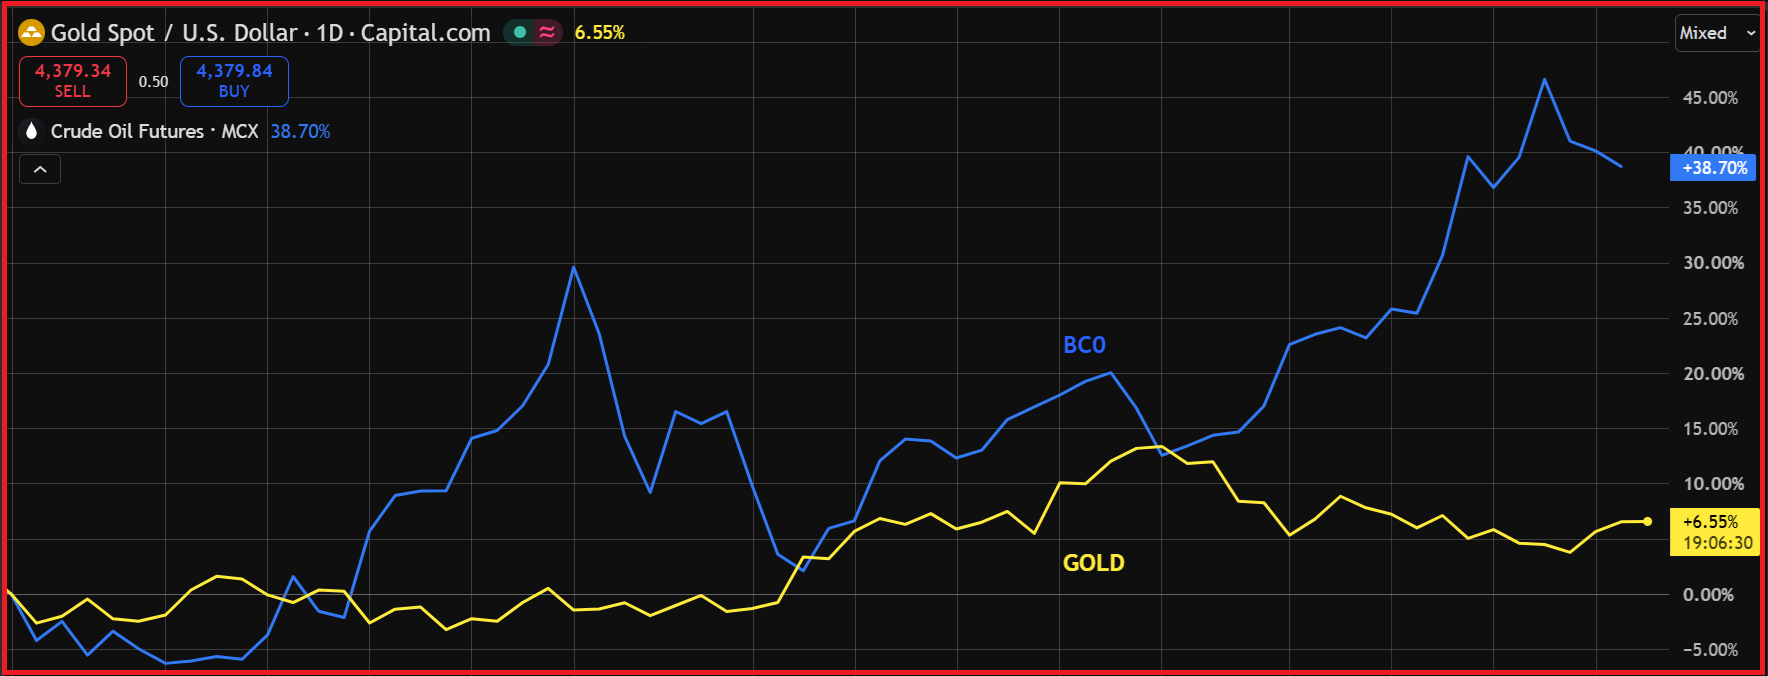
Gold prices experienced significant volatility throughout the week as markets responded to a combination of inflationary pressures, Federal Reserve monetary policy, and developments in global energy prices. At the beginning of the period, gold came under pressure, falling by around 0.8% to approximately US$4,312 per troy ounce after stronger-than-expected U.S. inflation data increased expectations of an interest rate hike. A stronger U.S. dollar and rising Treasury yields further limited gold’s upside, keeping prices within the US$4,290–US$4,310 range ahead of the Federal Reserve’s monetary policy decision.
Selling pressure intensified after the Federal Reserve raised interest rates by 25 basis points to a range of 3.75%–4.00%, marking its first rate increase since 2023. The decision initially pushed the U.S. dollar and Treasury yields higher, sending gold down to around US$4,235 per troy ounce, its lowest level since early August.
However, the weakness proved short-lived. Gold subsequently rebounded by more than 2% as some market participants covered short positions, with the rate increase seen as having already been largely priced in. The decline in oil prices also helped ease inflation concerns, reducing pressure on precious metals. Toward the end of the week, gold gained approximately 1.2% and recorded a weekly increase of around 1%, putting it on track to end three consecutive weeks of losses.
Meanwhile, Brent crude oil also experienced sharp volatility amid geopolitical developments and concerns over global supply. Brent initially traded near US$106 per barrel after reaching a four-month high of around US$110. Prices later climbed toward US$108.50 per barrel following reports that Saudi Arabia had cancelled several crude shipments after drone attacks disrupted a major export pipeline and temporarily halted loading operations in Yanbu.
However, the oil rally gradually lost momentum as markets received indications that Saudi Arabia’s East-West Pipeline could be restored in stages. Brent fell toward US$105 per barrel before weakening further to around US$104, after Saudi Arabia signalled that part of the damaged pipeline capacity could be restored within a relatively short period. Selling pressure continued, pushing Brent toward US$103 per barrel, although uncertainty remained elevated after satellite imagery and industry sources indicated damage to several key pumping stations.
Overall, movements in gold and oil during the period highlighted the interaction between Federal Reserve policy, inflation expectations, the U.S. dollar, Treasury yields, and geopolitical risks. The decline in oil prices ultimately helped ease inflationary pressure and provided additional support for gold’s recovery. Markets are expected to remain focused on developments in U.S. monetary policy as well as the potential for further disruptions to global energy supplies.
For the coming week, gold may continue its recovery phase after closing at around US$4,377 per troy ounce. As long as prices remain above the US$4,320–US$4,300 area, there is still room for a move toward US$4,400–US$4,450. A decisive break above US$4,400 could open the way for a further advance toward approximately US$4,500.
Conversely, if gold fails to hold above US$4,320, renewed selling pressure could push prices toward US$4,280 and potentially back to the US$4,235 area. Therefore, the US$4,400 level will be an important technical threshold in determining whether the rebound can continue or lose momentum.
For Brent crude oil, the broader trend remains relatively firm despite the current correction following the failure to hold above the US$108–US$110 per barrel area. As long as prices remain supported around US$100–US$102, a rebound toward US$104–US$106 remains possible. A sustained break above this zone could allow Brent to retest the US$108 level.
On the downside, a close below US$100 could extend the correction toward the US$96–US$98 area. For the week ahead, US$100 is therefore expected to act as an important support level, while US$104–US$106 represents a key resistance zone that would need to be cleared to restore stronger bullish momentum.
Note: This article is intended for analytical and informational purposes only and should not be considered a definitive investment reference or financial advice. Investors and traders should continue to monitor both fundamental and technical developments before making any investment or trading decisions.